Bitcoin (BTC) has just formed a textbook inverse Head & Shoulders pattern, signaling the beginning of a potential shift in its market structure. Despite the broader market selloff that pushed the cryptocurrency below $70,000, a crypto analyst suggests that the newly formed pattern indicates that a fresh bullish trend could be up ahead.
Bitcoin Head & Shoulder Pattern Signals Price Reversal
In an X post this Thursday, market analyst Crypto Tice declared that Bitcoin has printed a classic inverse Head & Shoulders pattern on its chart, renewing the debate over whether the market is on the verge of another historic breakout. He said that this pattern is a textbook structural signal that has formed over an extended period on the weekly timeframe.
Related Reading: Bitcoin Historical Performance Shows How Low The Price Will Go Before A Bottom
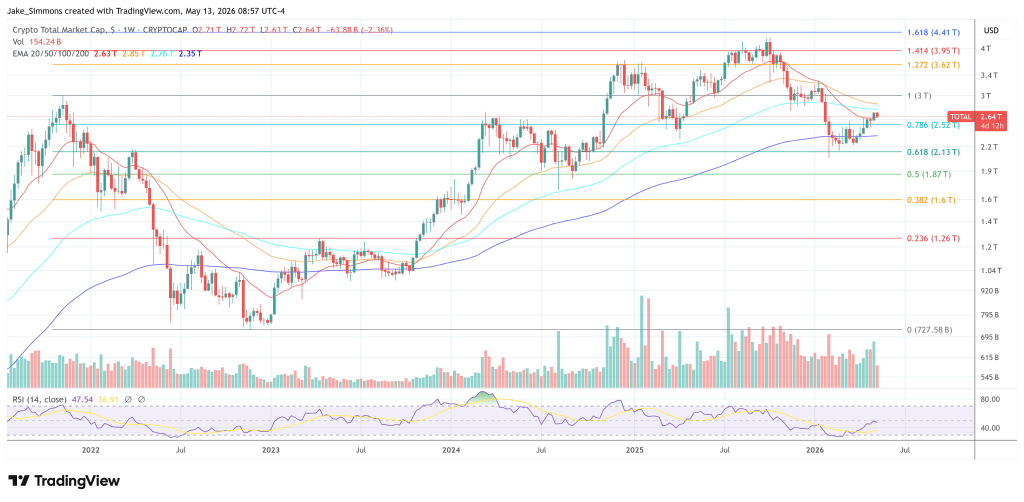
The chart highlights three distinct phases in Bitcoin’s price action, showing how the inverse Head and Shoulder pattern formed. The first stage saw a “Left Shoulder” emerge after an initial rally, followed by a deep decline that shaped the head of the Head and Shoulders pattern. Subsequently, prices climbed again to create a higher “Right Shoulder,” signaling that sellers were losing momentum while bulls were gradually asserting control.
A horizontal line across the previous swing highs on the price chart marks the neckline of the inverse Head and Shoulders pattern, which Crypto Tice highlights as a pivotal level for determining Bitcoin’s next major trend. According to him, Bitcoin is currently retesting this trendline, as a breakout from here could set the stage for a potential price rally.

Crypto Tice highlighted that the current retest should not be seen as a sign of weakness, but as confirmation that Bitcoin’s structure is still holding. He said that market sentiment at this stage often wavers among investors and traders. However, historical trends suggest that similar retests have preceded major price expansions.
Crypto Tice noted that the inverse Head and Shoulder pattern is a critical signal that often signals a transition from accumulation to expansion. Historically, accumulation phases allow buying pressure to build, followed by a breakout, a controlled pullback, and finally a retest confirmation.
Head & Shoulder Pattern Point To $215,000 Price Target
Above the neckline of Bitcoin’s Head & Shoulder pattern, Crypto Tice has set a projected target of $215,000 on the chart, indicating where the market could move if BTC breaks out decisively. With the cryptocurrency currently trading above $65,000, this would represent a roughly 231% increase.
Related Reading: Did Satoshi Nakamoto Sell 10,000 Bitcoin For $800 Million? Here’s The Truth
Given the recent market downtrend and Bitcoin’s price breakdown below $70,000, the analyst acknowledged that a sudden move to $200,000 sounds largely unrealistic. However, he noted that the same perception was held in past cycles before Bitcoin skyrocketed to new all-time highs against the odds. Concluding his analysis, Crypto Tice explained that large price trends rarely begin comfortably, noting that they typically emerge amid market hesitation and uncertainty.

You can get bonuses upto $100 FREE BONUS when you:
💰 Install these recommended apps:
💲 SocialGood - 100% Crypto Back on Everyday Shopping
💲 xPortal - The DeFi For The Next Billion
💲 CryptoTab Browser - Lightweight, fast, and ready to mine!
💰 Register on these recommended exchanges:
🟡 Binance🟡 Bitfinex🟡 Bitmart🟡 Bittrex🟡 Bitget
🟡 CoinEx🟡 Crypto.com🟡 Gate.io🟡 Huobi🟡 Kucoin.


Comments